Map Tunisia
Open-source maps of Tunisia, from the country outline to 2,083 imadas, with SVG, GeoJSON, and TopoJSON exports.
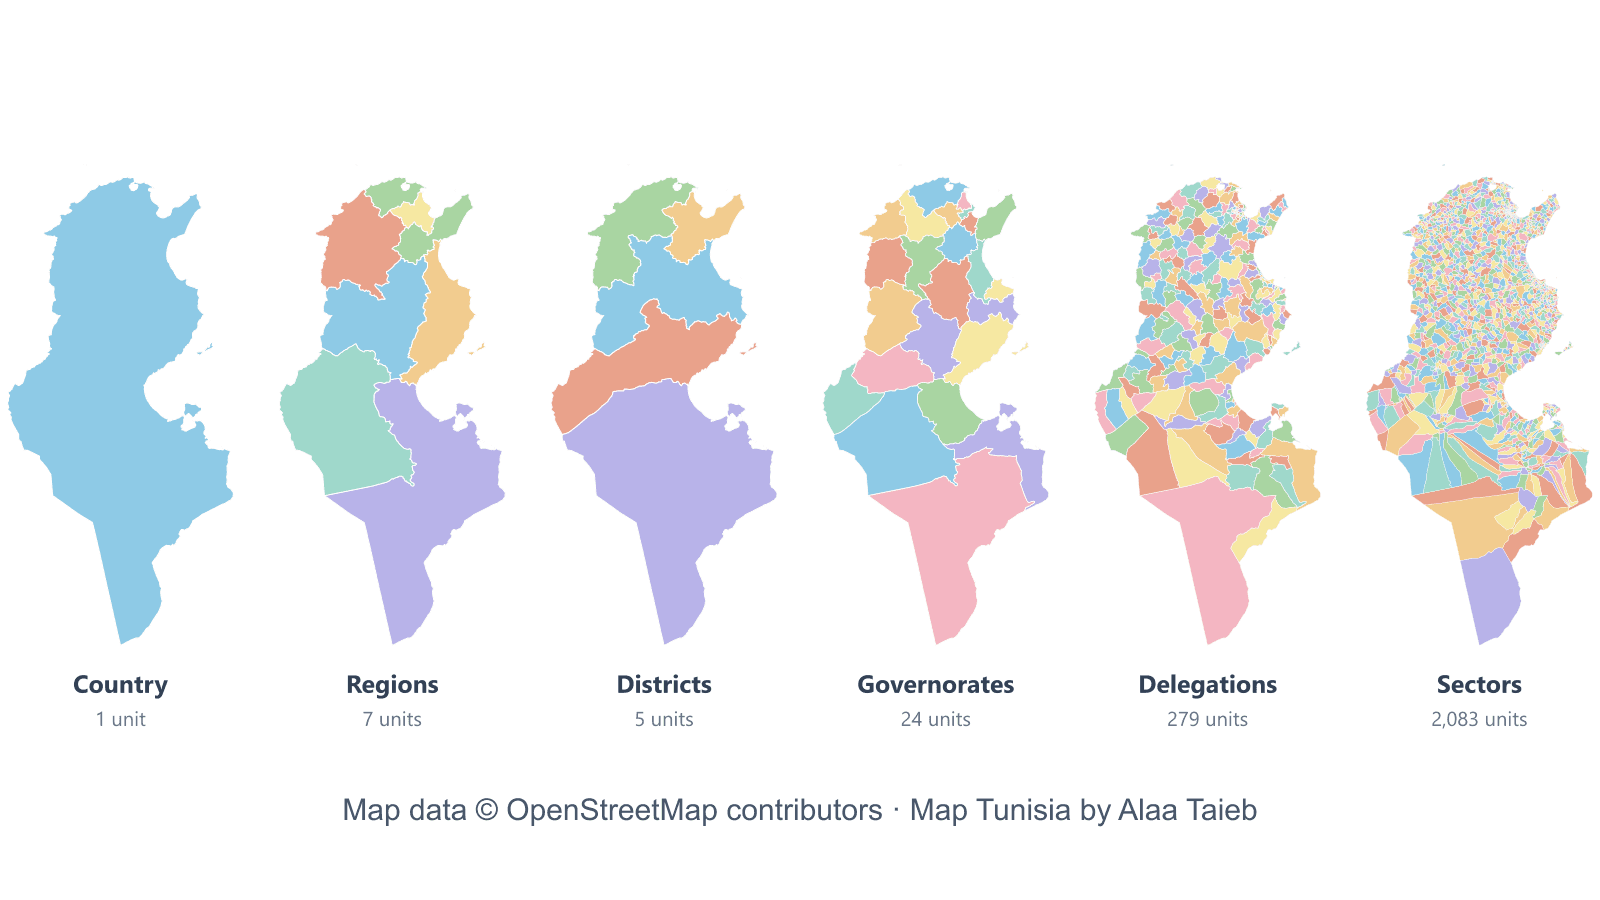
01 / tunisia maps for websites and data tools
Map Tunisia packages Tunisian boundaries as reusable maps and geographic data. It covers the country outline, seven economic regions, five districts, 24 governorates, 279 delegations, and 2,083 sectors, also called imadas.
The project is created and maintained by Alaa Taieb. Its published files include SVG maps for websites and design work, GeoJSON and TopoJSON for geographic tools, and CSV and JSON tables of names, codes, populations, and areas.
03 / detail and presentation choices
Five levels of detail range from full geometry to small map assets. Eight visual modes cover plain fills, outlines, light and dark palettes, Latin and Arabic labels, nested borders, and hover highlights with native tooltips. Available combinations depend on the partition and level of detail; the finest administrative layers omit the smallest detail level.
SVG shapes carry semantic identifiers and data attributes, including multilingual names and geographic codes, so a website can style individual units or connect them to its own data. The maps share a UTM zone 32N frame, with one SVG unit representing one kilometre. JavaScript helpers locate export files and convert longitude and latitude into that frame for placing markers.
The repository also includes an explorer interface with controls for choosing a partition, detail level, and visual mode, alongside download links and unit information.
04 / published scope and sources
This case study reflects source commit 4f59a1, whose manifest identifies an OpenStreetMap extract dated October 16, 2026. The repository includes checks for unit counts, identifiers, hierarchy, population totals, SVG output, and projection behavior.
Municipalities, optional water and city layers, and publication to the npm registry remain roadmap items in this snapshot. The existing files can be downloaded from GitHub; the JavaScript helpers can be installed directly from the repository.
Code is licensed under MIT. Maps, data, and the reused gallery graphics derive from OpenStreetMap and are distributed under ODbL 1.0. Map data © OpenStreetMap contributors · Map Tunisia by Alaa Taieb.